Automating Graph Generation with gnuplot
1. Login as student (Must be done at the VM “maximize mode”)
2. Click on loadserver.sh and select Save File and click OK
3. Open up the terminal and type:

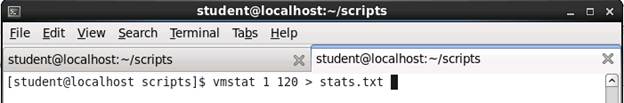
4. At the terminal open a second tab Shift+Ctrl+T and type the following and hit Enter
5. Now go back to the first terminal tab and execute the loadserver.sh script:
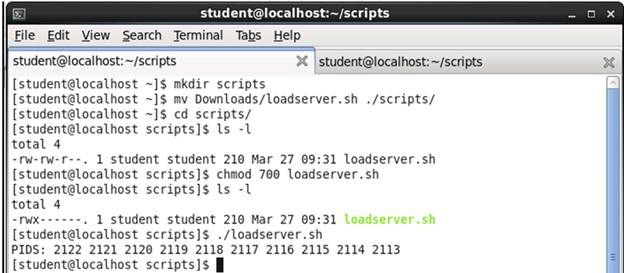
6. Wait a few seconds and kill the script by running killall:

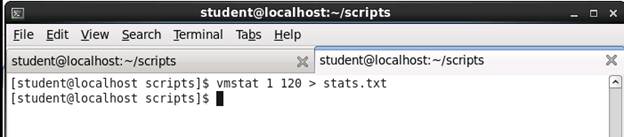
7. Go back to second terminal tab by this time the vmstat 1 120 > stats.txt should be done executing:
8. Let’s cat the output gather from stats.txt

9. We are ready to plot the stats. Using gnuplot run the follow commands:

10. After quiting gnuplot, return to the bash shell, where and use the eog image viewer to view the plot.
