|
SE 616 – Introduction to Software Engineering |
|
Lecture 8 |
Chapter
15: Product Metrics for Software
Overview
- Technical metrics used in the software quality assurance process
- Technical metrics used to assess the quality of the design and construction software product
- Technical metrics provide an objective basis for conducting analysis, design, coding, and testing
- Process:
- Derive software measures and metrics that are appropriate for the software representation under consideration.
- Data collected and metrics computed
- Metrics compared to pre-established guidelines and historical data.
- Results used to guide modifications made to work products arising from analysis, design, coding, or testing.
Measures, Metrics and Indicators
·
A measure provides a quantitative indication of the
extent, amount, dimension, capacity, or size of some attribute of a product or
process
·
The IEEE glossary defines a metric as “a
quantitative measure of the degree to which a system, component, or process
possesses a given attribute.”
·
An indicator is a metric or combination of metrics
that provide insight into the software process, a software project, or the
product itself
Measurement Principles
·
The objectives of measurement should be established before
data collection begins;
·
Each technical metric should be defined in an unambiguous
manner;
·
Metrics should be derived based on a theory that is valid
for the domain of application (e.g., metrics for design should draw upon basic
design concepts and principles and attempt to provide an indication of the
presence of an attribute that is deemed desirable);
·
Metrics should be tailored to best accommodate specific
products and processes
Measurement Process
·
Formulation. The derivation of software measures and
metrics appropriate for the representation of the software that is being
considered.
·
Collection. The mechanism used to accumulate data
required to derive the formulated metrics.
·
Analysis. The computation of metrics and the
application of mathematical tools.
·
Interpretation. The evaluation of metrics results in an
effort to gain insight into the quality of the representation.
·
Feedback. Recommendations derived from the
interpretation of product metrics transmitted to the software team.
Goal-Oriented Software Measurement
· The Goal/Question/Metric Paradigm
·
(1) establish an explicit measurement goal that is
specific to the process activity or product characteristic that is to be
assessed
·
(2) define a set of questions that must be answered
in order to achieve the goal, and
·
(3) identify well-formulated metrics that help to
answer these questions.
· Goal definition template
·
Analyze {the name of activity or attribute to be measured}
·
for the purpose of {the overall objective of the analysis}
·
with respect to {the aspect of the activity or attribute
that is considered}
·
from the viewpoint of {the people who have an interest in
the measurement}
·
in the context of {the environment in which the measurement
takes place}.
Metrics Attributes
·
simple and computable. It should be relatively easy to learn
how to derive the metric, and its computation should not demand inordinate
effort or time
·
empirically and intuitively persuasive. The metric
should satisfy the engineer’s intuitive notions about the product attribute under
consideration
·
consistent and objective.
The metric should always yield results that are unambiguous.
·
consistent in its use of units and dimensions. The mathematical
computation of the metric should use measures that do not lead to bizarre
combinations of unit.
·
programming language independent. Metrics should be based on the analysis
model, the design model, or the structure of the program itself.
·
an effective mechanism for quality feedback. That is, the
metric should provide a software engineer with information that can lead to a
higher quality end product
Collection and Analysis Principles
·
Whenever possible, data collection and analysis should be
automated;
·
Valid statistical techniques should be applied to establish
relationship between internal product attributes and external quality
characteristics
·
Interpretative guidelines and recommendations should be
established for each metric
Software
Quality Principles
- Quality is measured as conformance to software requirements
- Specified standards define a set of development criteria that guide the manner in which software is engineered.
- Software quality is suspect when a software product conforms to its explicitly stated requirements and fails to conform to the customer's implicit requirements (e.g. ease of use).
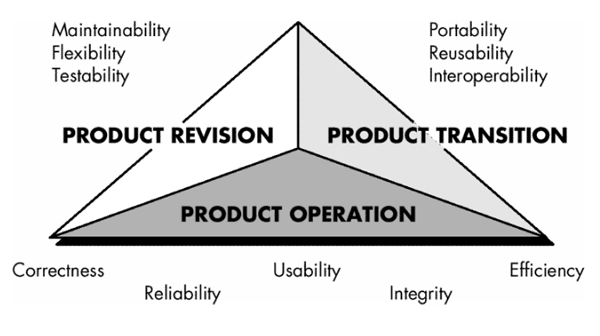
McCall's Quality Factors
- Correctness - The extent to which a program satisfies its specification and fulfills the customer's mission objectives.
- Reliability - The extent to which a program can be expected to perform its intended function with required precision.
- Efficiency - The amount of computing resources and code required by a program to perform its function.
- Integrity - Extent to which access to software or data by unauthorized persons can be controlled. Usability - Effort required to learn, operate, prepare input, and interpret output of a program.
- Maintainability - Effort required to locate and fix an error in a program.
- Flexibility - Effort required to modify an operational program.
- Testability - Effort required to test a program to ensure that it performs its intended function.
- Portability - Effort required to transfer the program from one hardware and/or software system environment to another.
- Reusability - Extent to which a program [or parts of a program] can be reused in other applications — related to the packaging and scope of the functions that the program performs.
- Interoperability - Effort required to couple one system to another.
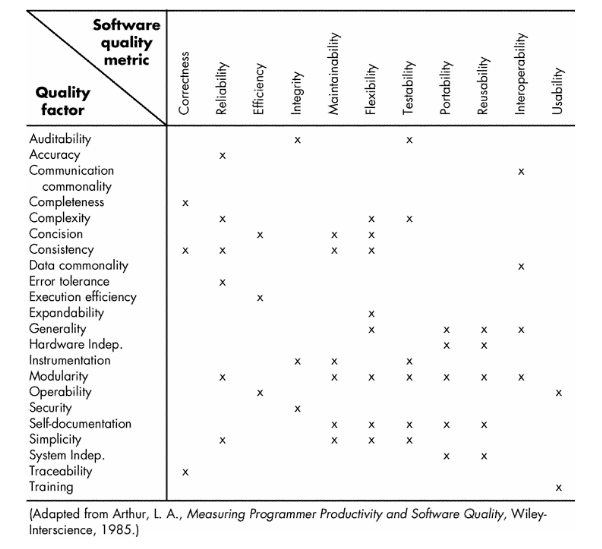
McCall's
Software Metrics - (Subjective)
- Auditability - The ease with which conformance to standards can be checked.
- Accuracy - The precision of computations and control.
- Communication commonality - The degree to which standard interfaces, protocols, and bandwidth are used.
- Completeness - The degree to which full implementation of required function has been achieved.
- Conciseness - The compactness of the program in terms of lines of code.
- Consistency - The use of uniform design and documentation techniques throughout the software development project.
- Data commonality - The use of standard data structures and types throughout the program.
- Error tolerance - The damage that occurs when the program encounters an error.
- Execution efficiency - The run-time performance of a program.
- Expandability - The degree to which architectural, data, or procedural design can be extended.
- Generality - The breadth of potential application of program components.
- Hardware independence - The degree to which the software is decoupled from the hardware on which it operates.
- Instrumentation - The degree to which the program monitors its own operation and identifies errors that do occur.
- Modularity - The functional independence (Chapter 13) of program components.
- Operability - The ease of operation of a program.
- Security - The availability of mechanisms that control or protect programs and data.
- Self-documentation - The degree to which the source code provides meaningful documentation.
- Simplicity - The degree to which a program can be understood without difficulty.
- Software system independence - The degree to which the program is independent of nonstandard programming language features, operating system characteristics, and other environmental constraints.
- Traceability - The ability to trace a design representation or actual program component back to requirements.
- Training - The degree to which the software assists in enabling new users to apply the system.
Relationship
between quality factors and metrics
FURPS
Quality Factors (Hewlett-Packard)
- Functionality is assessed by evaluating the feature set and capabilities of the program, the generality of the functions that are delivered, and the security of the overall system.
- Usability is assessed by considering human factors, overall aesthetics, consistency, and documentation.
- Reliability is evaluated by measuring the frequency and severity of failure, the accuracy of output results, the mean-time-to-failure (MTTF), the ability to recover from failure, and the predictability of the program.
- Performance is measured by processing speed, response time, resource consumption, throughput, and efficiency.
- Supportability combines the ability to extend the program (extensibility), adaptability, serviceability—these three attributes represent a more common term, maintainability—in addition, testability, compatibility, configurability (the ability to organize and control elements of the software configuration), the ease with which a system can be installed, and the ease with which problems can be localized.
ISO
9126 Quality Factors
- Functionality -The degree to which the software satisfies stated needs as indicated by the following subattributes: suitability, accuracy, interoperability, compliance, and security.
- Reliabilit - The amount of time that the software is available for use as indicated by the following subattributes: maturity, fault tolerance, recoverability.
- Usability - The degree to which the software is easy to use as indicated by the following subattributes: understandability, learnability, operability.
- Efficiency - The degree to which the software makes optimal use of system resources as indicated by the following subattributes: time behavior, resource behavior.
- Maintainability - The ease with which repair may be made to the software as indicated by the following subattributes: analyzability, changeability, stability, testability.
- Portability - The ease with which the software can be transposed from one environment to another as indicated by the following subattributes: adaptability, installability, conformance, replaceability.
Measurement
Process Activities
- Formulation – derivation of software measures and metrics appropriate for software representation being considered
- Collection – mechanism used to accumulate the data used to derive the software metrics
- Analysis – computation of metrics
- Interpretation – evaluation of metrics that results in gaining insight into quality of the work product
- Feedback – recommendations derived from interpretation of the metrics is transmitted to the software development team
Formulation
Principles for Technical Metrics
- The objectives of measurement should be established before collecting any data.
- Each metric is defined in an unambiguous manner.
- Metrics should be based on a theory that is valid for the application domain.
- Metrics should be tailored to accommodate specific products and processes.
Software
Metric Attributes
- Simple and computable - It should be relatively easy to learn how to derive the metric, and its computation should not demand inordinate effort or time.
- Empirically and intuitively persuasive - The metric should satisfy the engineer's intuitive notions about the product attribute under consideration (e.g., a metric that measures module cohesion should increase in value as the level of cohesion increases).
- Consistent and objective - The metric should always yield results that are unambiguous. An independent third party should be able to derive the same metric value using the same information about the software.
- Consistent in its use of units and dimensions - The mathematical computation of the metric should use measures that do not lead to bizarre combinations of units. For example, multiplying people on the project teams by programming language variables in the program results in a suspicious mix of units that are not intuitively persuasive.
- Programming language independent - Metrics should be based on the analysis model, the design model, or the structure of the program itself. They should not be dependent on the vagaries of programming language syntax or semantics.
- An effective mechanism for high-quality feedback - That is, the metric should provide a software engineer with information that can lead to a higher-quality end product.
Representative
Analysis Metrics
- Function-based metrics - predict the size of a system that will be derived from the analysis model
e.g.
Part of the analysis model for SafeHome software
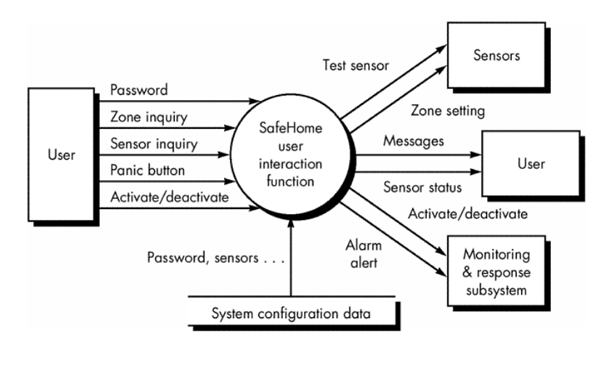
- Data flow diagram evaluated to determine the key measures required for computation of the function point metric
- number of user inputs - password, panic button, and activate/deactivate
- number of user outputs - messages and sensor status
- number of user inquiries - zone inquiry and sensor inquiry
- number of files - system configuration file
- number of external interfaces - test sensor, zone setting, activate/deactivate, and alarm alert
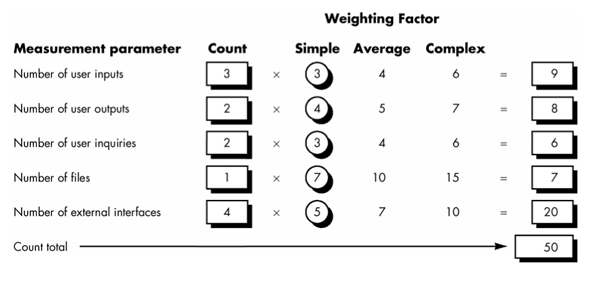
- Count total shown must be adjusted using Function Point (FP):
FP = count total x
[0.65 + 0.01 x S (Fi)]
where count total is the sum of all FP entries and Fi (i = 1 to 14) are "complexity adjustment values." For the purposes of this example, we assume that S (Fi) is 46 (a moderately complex product).
FP = 50 x [0.65 +
(0.01 x 46)] = 56
- Project team can estimate the overall implemented size of the SafeHome user interaction function.
- Assume:
- Past data indicates that one FP translates into 60 lines of code (an object-oriented language is to be used)
- 12 FPs are produced for each person-month of effort.
- Assume:
- Past projects have found an average of three errors per function point during analysis design reviews
- Four errors per function point during unit and integration testing.
- These data can help software engineers assess the completeness of their review and testing activities.
- Bang metric (Tom DeMarco) - used to develop an indication of the size of the software to be implemented as a consequence of the analysis model
- Computed by evaluating a set of primitives—elements of the analysis model that are not further subdivided at the analysis level
- Functional primitives (FuP) - The number of transformations (bubbles) that appear at the lowest level of a data flow diagram
- Data elements (DE) - The number of attributes of a data object, data elements are not composite data and appear within the data dictionary
- Objects (OB) - The number of data objects
- Relationships (RE) - The number of connections between data objects
- States (ST) - The number of user observable states in the state transition diagram
- Transitions (TR) - The number of state transitions in the state transition diagram
- Additional counts
- Modified manual function primitives (FuPM). Functions that lie outside the system boundary but must be modified to accommodate the new system.
- Input data elements (DEI). Those data elements that are input to the system.
- Output data elements (DEO). Those data elements that are output from the system.
- Retained data elements (DER). Those data elements that are retained (stored) by the system.
- Data tokens (TCi). The data tokens (data items that are not subdivided within a functional primitive) that exist at the boundary of the ith functional primitive (evaluated for each primitive).
- Relationship connections (REi). The relationships that connect the ith object in the data model to other objects.
- Software Classification:
- function strong - emphasize the transformation of data and do not generally have complex data structures
- data strong - tend to have complex data models
RE/FuP < 0.7 implies a function-strong application
0.8 < RE/FuP < 1.4 implies a hybrid application
RE/FuP > 1.5 implies a data-strong application
- Specification Quality Metrics (Davis)
- Characteristics that can be used to assess the quality of the analysis model and the corresponding requirements specification
- specificity (lack of ambiguity)
- completeness
- correctness
- understandability
- verifiability
- internal and external consistency
- achievability
- concision
- traceability
- modifiability
- precision
- reusability
Representative
Design Metrics
- Architectural design metrics
- Focus on characteristics of the program architecture with emphasis on the architectural structure and the effectiveness of modules
- Black box - do not require any knowledge of the inner workings of a particular software component
- Structural complexity
- Based on module fanout - the number of modules immediately subordinate to module i; that is, the number of modules that are directly invoked by module i.
S(i) = f 2out (i)
- Data complexity
- Based on module interface inputs and outputs
- Indication of the complexity in the internal interface for a module i
D(i) = v(i) / [ fout (i) ]
where v(i) is the number of input and output variables that are passed to and from module i
- System complexity
- Sum of structural and data complexity
C(i) = S(i) + D(i)
- Morphology (Shape)
- Number of nodes and arcs in program graph
- Different program architectures to be compared using a set of straightforward dimensions
size = n + a
where n is the number of nodes and a is the number of arcs
- e.g. For the following architecture
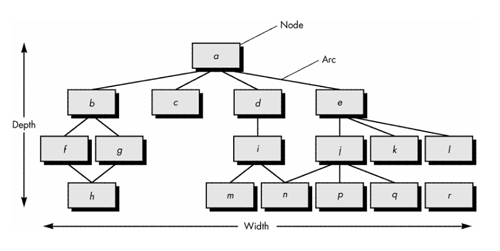
size = 17 + 18 = 35
depth = the longest path from the root (top) node to a leaf node
For
above - depth = 4.
width = maximum number of nodes at any one level of the architecture
For above - width = 6.
arc-to-node ratio, r = a/n, measures connectivity density of the
architecture
For above - r = 18/17 = 1.06
- Design structure quality index (DSQI) - (US Air Force)
- Information from data and architectural design to derive a design structure quality index (DSQI) that ranges from 0 to 1
s1 = the total number of modules defined in the
program architecture.
s2 = the number of modules whose correct function depends
on the source of data input or that produce data to be used elsewhere (in
general, control modules, among others, would not be counted as part of ).
s3 = the number of modules whose correct function
depends on prior processing.
s4 = the number of database items (includes data objects
and all attributes that define objects).
s5 = the total number of unique database items.
s6 = the number of database segments (different records or
individual objects).
s7 = the number of modules with a single entry and exit
(exception processing is not considered to be a multiple exit).
- Once values s1 through s7 are determined for a computer program, the following intermediate values can be computed:
Program structure: D1, where D1 is defined as follows:
- If the architectural design was developed using a distinct method (e.g., data flow-oriented design or object-oriented design), then D1 = 1, otherwise D1 = 0.
Module independence: D2 = 1 - (s2/s1)
Modules not dependent on
prior processing: D3
= 1 - (s3/s1)
Database size: D4 = 1 - (s5/s4)
Database
compartmentalization:
D5 = 1 - (s6/s4)
Module entrance/exit
characteristic: D6
= 1 - (s7/s1)
- With these intermediate values determined, the DSQI is computed in the following manner:
DSQI = SUM(wiDi)
where
i = 1 to 6, wi
is the relative weighting of the importance of each of the intermediate values,
and S wi = 1 (if all Di are weighted equally, then wi = 0.167).
- Value of DSQI for past designs can be determined and compared to a design that is currently under development.
- If the DSQI is significantly lower than average, further design work and review are indicated.
- If major changes are to be made to an existing design, the effect of those changes on DSQI can be calculated.
Component-level
design metrics
- Focus on internal characteristics of a software component and include measures of module cohesion, coupling, and complexity
- Cohesion metrics -
- measure cohesiveness of a module
- Data slice - A data slice is a backward walk through a module that looks for data values that affect the module location at which the walk began.
- Data tokens - Variables defined for a module can be defined as data tokens
- Glue tokens - Set of data tokens that lies on one or more data slice.
- Superglue tokens - Data tokens common to every data slice in a module.
- Stickiness - Relative stickiness of a glue token is directly proportional to the number of data slices that it binds.
- cohesion metrics range in value between 0 and 1
- Value of 0 : zero weak functional cohesion and zero adhesiveness
- when a procedure has more than one output and exhibits none of the cohesion attribute indicated by a particular metric
- procedure with no superglue tokens, no tokens that are common to all data slices - no data tokens that contribute to all outputs
- Value of 1 : strong functional cohesion and adhesiveness
- Coupling metrics -
- An indication of the "connectedness" of a module to other modules, global data, and the outside environment
- Computation -
- For data and control flow coupling,
di = number of input data parameters
ci = number of input control parameters
do
= number of output data
parameters
co = number of output control parameters
- For global coupling,
gd = number of global variables used as data
gc
= number of global
variables used as control
- For environmental coupling,
w
= number of modules called (fan-out)
r = number of modules calling the module
under consideration (fan-in)
- Using these measures, a module coupling indicator, mc, is defined in the following way:
mc = k/M
where k = 1, a proportionality constant and
M = di + (a x ci) + do
+ (b x co) + gd + (c x gc) + w + r
where
a = b = c
= 2
- Higher the value of mc, the lower the overall module coupling.
- e.g. if a module has single input and output data parameters, accesses no global data, and is called by a single module,
mc = 1/(1 + 0 + 1+ 0 + 0 + + 0 +
1 + 0) = 1/3 = 0.33
- Module exhibits low coupling - mc = 0.33 implies low coupling
- e.g. if a module has five input and five output data parameters, an equal number of control parameters, accesses ten items of global data, has a fan-in of 3 and a fan-out of 4,
mc = 1/[5 + (2 x 5) + 5 + (2 x
5) + 10 + 0 + 3 + 4] = 0.02
- implied coupling would be high.
- Revise coupling metric so it moves upward as the degree of coupling increases
C = 1 - mc
where the degree of coupling increases nonlinearly between a minimum value in the range 0.66 to a maximum value that approaches 1.0.
- Complexity metrics (e.g. cyclomatic complexity)
- Complexity metrics can be used to predict critical information about reliability and maintainability of software systems from automatic analysis of source code [or procedural design information].
- Complexity metrics provide feedback during the software project to help control the [design activity].
- During testing and maintenance, they provide detailed information about software modules to help pinpoint areas of potential instability.
- Most widely used complexity metric for computer software is cyclomatic complexity, developed by Thomas McCabe
- quantitative measure of testing difficulty and an indication of ultimate reliability
- Experimental studies - distinct relationships between the McCabe metric and
- the number of errors existing in source code
- time required to find and correct such errors
- May be used to provide a quantitative indication of maximum module size
- Data from programming projects - cyclomatic complexity = 10
- Appears to be a practical upper limit for module size
- When the cyclomatic complexity exceeded this number, it became extremely difficult to adequately test a module
- Interface design metrics (e.g. layout appropriateness)
- layout appropriateness (LA) is a worthwhile design metric for human/computer interfaces
- GUI uses layout entities—graphic icons, text, menus, windows to assist in completing tasks
- For a specific layout a cost can be assigned to each sequence of actions according to the following relationship:
cost = Sum[frequency of transition(k) x cost
of transition(k)]
- where k is a specific transition from one layout entity to the next as a specific task is accomplished.
- Summation occurs across all transitions for a particular task or set of tasks required to accomplish some application function.
- Cost may be characterized in terms of time, processing delay, or any other reasonable value, such as the distance that a mouse must travel between layout entities.
- Layout appropriateness is defined as
LA = 100 x [ (cost of LA - optimal layout)/(cost of
proposed layout)]
where LA = 100 for an optimal layout.
- To compute the optimal layout for a GUI:
- interface real estate (the area of the screen) is divided into a grid
- Each square of the grid represents a possible position for a layout entity
- For a grid with N possible positions and K different layout entities to place, the number of possible layouts is
number of possible layouts = [N!/(K! x (N -
K)!] x K!
Source
Code Metrics - Halstead's Software Science
- Assigns quantitative laws to the development of computer software, using a set of primitive measures that may be derived after code is generated or estimated once design is complete
n1 = the number of distinct operators
that appear in a program.
n2 = the number of distinct operands
that appear in a program.
N1 = the total number of operator
occurrences.
N2 = the total number of operand
occurrences
- Uses these primitive measures to develop expressions for
- Overall program length
- Potential minimum algorithm volume
- Actual algorithm volume (number of bits used to specify program)
- Program level (software complexity)
- Language level (constant for given language)
- Length N can be estimated
N = n1 log2 n1
+ n2 log2 n2
- Program volume may be defined
V = log2 ( n1
+ n2 )
- V varies with programming language and represents the volume of information (in bits) required to specify a program
- Minimum volume must exist for a particular algorithm
- Volume ratio L: the ratio of volume of the most compact form of a program to the volume of the actual program
L = 2/n1 * n2 /N2
Testing
Metrics
- Metrics that predict the likely number of tests required during various testing phases
- Can use Halstead measure
- Metrics that focus on test coverage for a given component
Maintenance
Metrics
- Software Maturity Index (IEEE Standard 982.1-1988)
- provides an indication of the stability of a software product (based on changes that occur for each release of the product).
- Computes the following:
MT = the number of modules in the
current release
Fc = the number of modules in the current
release that have been changed
Fa = the number of modules in the current
release that have been added
Fd = the number of modules from the preceding
release that were deleted in the current release
- Software maturity index is computed as:
SMI = [MT - (Fa
+ Fc + Fd)] / MT
- As SMI approaches 1.0 as product begins to stabilize