Introduction | The Task | Process and Resources | Evaluation | Conclusion
Geometry offers a means of describing, analyzing, and understanding the world and seeing beauty in its structures. Geometric ideas are useful both in other areas of mathematics and in applied settings. For example, symmetry can be useful in looking at functions; it also figures heavily in the arts, in design, and in the sciences. The Geometry Standard from the NCTM states that students should use geometric ideas to solve problems in, and gain insights into, other disciplines and other areas of interest such as art and architecture.
In the words of Leonardo da Vinci, "...no human
inquiry can be called science unless it pursues its path through mathematical
exposition and demonstration." It is with this thought in mind,
combined with the statement by Johannes Kepler,
"Geometry has two great treasures: one is the Theorem of Pythagoras, the other, the division of a
line into extreme and mean ratio. The first we may compare to a
measure of gold, the second we may name a precious jewel",
that the objective of this unit is to study the nature of the Golden Mean, Golden
Rectangle and Golden Spiral from its historical development through its use in
architecture and fine art.
Part I of
this project involves cooperative work by students, using the internet as a
research tool.
Your first task is to research the historical background of the golden
ratio as well as investigate examples of the golden spiral in nature.
In mathematical analysis, you will calculate the golden ratio and then generate the Fibonacci Sequence and find the relationship between Fibonacci numbers and the golden ratio.
As a hands-on activity, you are to create a golden rectangle or golden spiral using any medium of your choice.
As a culminating project for the cooperative work, you are to prepare a class presentation, using power point, which will include the above work making connections between the golden ratio, golden rectangle and the golden spiral.
Part II of
this project will allow each individual student to select one are of
continued investigation from either:
1) Architecture
2) Abstract Art
3) Further Mathematical Investigation
.
Part I -
See Teacher Notes
A. Research - Golden Ratio
(Week 1)
See Fibonacci
& The Golden Ratio
1.
Historical background
2. Other Names for the Ratio
B. Mathematical Analysis
1.
Calculate the Golden Ratio
2. Explain how to
generate the Fibonacci Sequence and list the first 20 terms of the sequence.
3. Find the relationship
between Fibonacci Numbers and the Golden Ratio.
C. Construction (Week 2)
1.
You and your partner will construct either a golden rectangle or a
golden spiral. Use any
medium of your choice.
These constructions will be used to decorate our classroom so please keep
scale
in mind.
D. Power Point Presentation (Week 4)
1.
Your power point presentation should be 8-10 slides maximum, including your
title slide.
2. As part of your
presentation please include the following:
a. Make a connection between the golden ratio, golden rectangle, and
golden spiral.
b. Give examples of the golden spiral in nature with explanations.
Part II - (Week
5-6) This part of the project will be done on an individual
basis.
Select ONE of the following areas:
A. Architecture
1. Read the
accompanying literature (excerpts from A Beginner's Guide to
Constructing the Universe)
2. Design a facade to
scale, of a building, using golden rectangles (Medium of your choice)
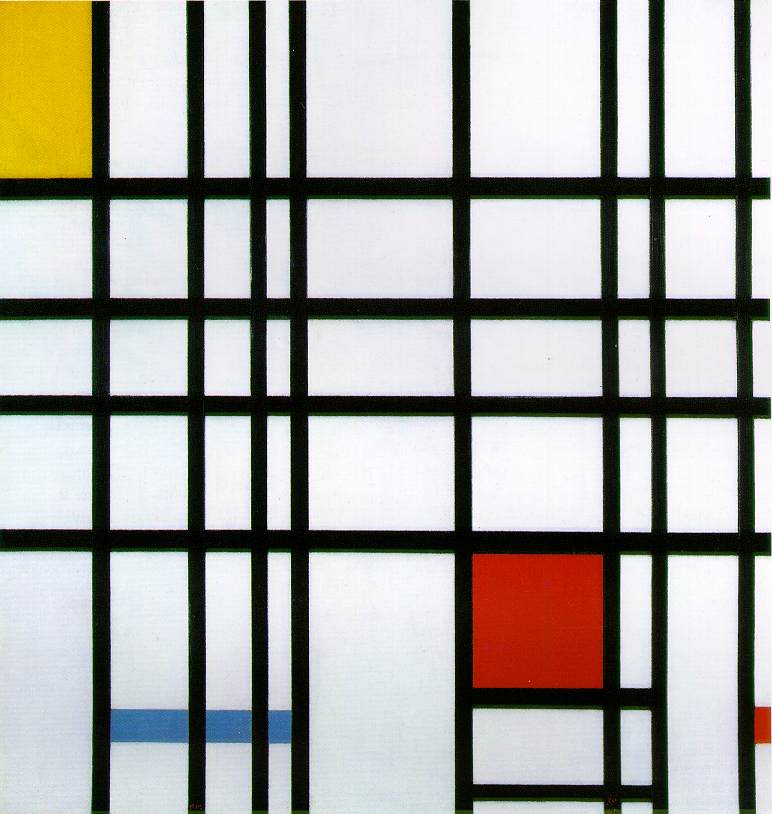
B. Abstract Art
1. Study
Composition with Red, Blue and Yellow by Piet Mondrian
2. Prepare a one page report on Piet
Mondrian
3. Give examples of his work
4. Discuss whether the golden
rectangle may have influenced the piece studied in "1".
Evaluation
- There are several components to this
project. Please review the rubric carefully for
how your project will be evaluated.
Rubric for Assessment
Part I
Research
|
Acceptable 1-2 |
Admirable 3-4 |
Awesome 5-6 |
|
|
|
|
|
|
|
|
|
|
|
|
Mathematical Analysis
|
|
|
|
|
|
|
|
|
Power Point Presentation
|
|
|
|
|
|
|
|
|
Part II
(Only 1 of the Following Categories Are To Be Selected)
|
Architecture |
||
|
|
|
|
Abstract Art |
||
|
|
|
|
Calculus |
||
|
|
|
What have you learned after completing this project? Was it easier or more difficult than you expected? Did completing the project give you a better understanding of the material? What would you like to explore further? Write a reflection paper on the above topics.
![]()
Created by Jan von Stein
The Masters School, Dobbs Ferry, NY
Grade: 9-12 Subject: Mathematics
Standards Addressed: Statistics & Probability
Date: September 26, 2000
Email :vonsteinj@worldnet.att.net