CS 397Z / CS 632D - Visual Computing
Midterm Take-home Exam
Dr. Francis T. Marchese
Due Date:
In 2007 Ralph Lengler & Martin J. Eppler
published a paper entitled “Towards A Periodic Table of Visualization Methods
for Management,” (Lengler and Eppler, 2007) that was later transformed into a webpage.
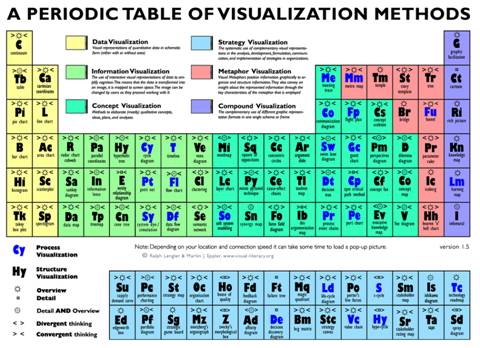
The problem with this table is that the periodic
table of the elements is a poor metaphor for representing anything but the
chemical elements. Since its appearance, this table has been much criticized (e.g.
see Few).
The idea of organizing the basic concepts and
methods of visualization into a easily accessible form is a good one. Thus, for
your midterm exam, you are to redesign all or part of this table so it
makes more sense.
To begin, read Wainer’s (1992, 1997) rules for
evaluating table quality. And see Marchese (2008) for how they are used to
evaluate the periodic tables of the elements. Then take a section of this
table, say for example data visualization, and try to work out a better
tabular structure. Look at the number of dimensions, types of charts, etc. to
see what kinds of relationships exist. Try to find patterns. Then come up with
a table design that reflects those patterns.
The process you follow is up to you. You may
discuss the exam with anyone. But, if an individual has provided an idea that
you have used for your design, give that person credit. If you use any kinds of
other resources for you design – reference them. Here, the process is as
important as the product.
You should turn in an electronic document that
contains your table design. You can sketch it out, use any visualization or
drawing tool. You should discuss the process that went into the design,
including any other designs you considered along the way. You should defend
your design by using Wainer’s rules.
References
S. Few, http://www.perceptualedge.com/blog/?p=81
R. Lenglerand M.J. Eppler.
2007. ”Towards a periodic table of
visualization methods of management.” In Proceedings of the IASTED
international Conference on Graphics and Visualization in Engineering (
F.T. Marchese. 2008.
“The Chemical Table: An Open Dialog between Visualization and Design,” In Proceedings
of the 12th International Conference on Information Visualization: IV'08.
IEEE Computer Society,
H. Wainer. 1992. “Understanding
graphs and tables,” Educational Researcher, 21, 1, January- February
1992, pp. 12-23. PDF
H. Wainer. 1997. “Improving
tabular displays, with NAEP: Tables as examples and inspirations,” Journal
of Educational and Behavioral Statistics, Spring 1997, 22, 1, pp. 1-30. PDF