|
Francis T. Marchese |
|
Research |
|
Molecular Visualization at the Interface.
(review) |
||||
|
The Chemical Table: An Open Dialog
between Visualization and Design |
||||
|
The Potential for Synergy between
Information Visualization and Software Engineering Visualization |
||||
|
|
||||
|
On Requirements Visualization |
||||
|
CrystalDome: A Projected Hemispherical Display with a Gestural Interface. |
||||
|
Fostering Asynchronous Collaborative
Visualization. |
||||
|
An Augmented Wiki
for Interactive Scientific Visualization and Evolutionary Collaboration. |
||||
|
The Making of Trigger and the Agile Engineering of Artist-Scientist
Collaboration. |
||||
|
|
||||
|
Reasoning and Representation: the
Sketching of Organic Chemical Reaction Mechanisms |
||||
|
|
|
|||
|
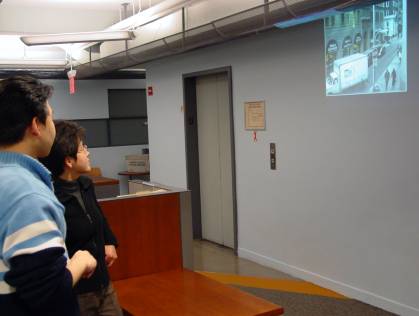
Plato’s Cave: an Image Stream
Installation within an Office Setting PDF |
||||
|
|
Many people work in windowless offices
where they are deprived of the sight of their outside environment. With this
in mind we created a piece where a view of the surrounding neighborhood is
streamed from a camera, through a network, and projected as an ambient
display on a blank wall in a hallway of the School of Computer Science and
Information Systems (CSIS) at Pace University. We discuss the simile of
Plato’s cave with relationship to our viewers, and comment on the artistic
influences of Claude Monet and Camille Pissarro. |
|||
|
Dynamically Binding Image to Text for
Information Communication PDF |
||||
|
|
The purpose of this paper is to
demonstrate that a tight dynamical connection may be made between text and
interactive visualization imagery. It shows that a bi-directional linkage may
be created between the image space of a visualization program and hypertext
space so that dynamical image and text representations of a data object are
synchronized, thus maintaining the consistency of the visual information and
information context. The paper begins with an analysis of the relationship
between text and image, drawing upon examples from the history of art. It
then discusses how text and imagery may be bound to improve the communication
of information. Finally, a simple mapping application is created employing
XML, HTML, and Scalable Vector Graphics (SVG) demonstrating these principles.
|
|||
|
A Peer to Peer Collaborative 3D
Virtual Environment for Visualization PDF |
||||
|
|
A peer-to-peer collaborative visualization system has been
built that can support both traditional displays and 3D virtual reality
hardware. The software is built around Sun’s Java3D graphics and JXTA
peer-to-peer networking APIs, allowing two users to load VRML geometry files
and manipulate their contents. Although this software takes advantage of VR
hardware, it may be used between any two Java supporting peers. Finally,
because no dedicated server is required, collaborative visualizations across
the web become easier to initiate and more spontaneous. |
|||
|
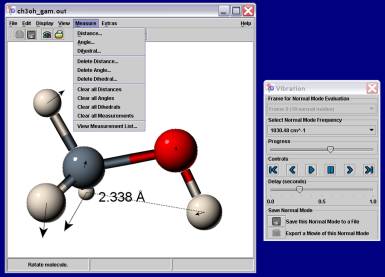
Adapting Single-User Visualization
Software for Collaborative Use HTML PDF |
|
|
|
Sun’s Java
JXTA API is used to adapt an open-source molecular visualization program
called Jmol. It was found that by focusing on the
program’s graphical user interface the software could be quickly transformed
into a peer-to-peer application. Our positive experience implies that many
useful single-user programs should be transformable into tools that make
collaboration across the web easier to initiate, more spontaneous, and
supported by a wide range of visualization software. |
|
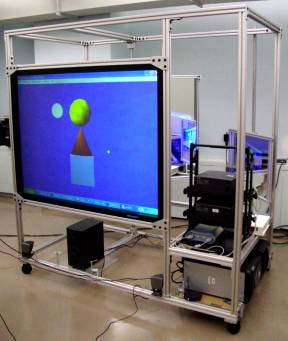
A Stereographic Table for Biomolecular
Visualization
HTML PDF |
||||
|
|
An inexpensive, stereographic table
has been built to support molecular visualization with mainstream software
that runs under Microsoft Windows. Any Windows-based software that supports
side-by-side stereo pairs can be easily run on the stereographic table. This
paper presents the table’s design, construction, costs, and initial user
experiences. |
|||
|
OpGlyph: A Tool for Exploring Op Art Representation of Height Field and
Vector Field Data |
|
|
|
We report our experiences with application of the optical
art techniques of Victor Vasarely and Bridget Riley
to visualization of height field and vector field data. The bold use of color
and simple form in Op Art engages the preattentive
processing ability of the human visual system, facilitating a nearly
instantaneous perception of image properties without the need for extended
scrutiny of component parts. A software system called Op-Glyph was
constructed to illustrate the Op Art method for data visualization, providing
a user with extensive control over a visual representation’s primitives,
including shape, size, and color. Initial results suggest that this
glyph-based approach to data visualization may be a viable alternative or
complement to more complex representation schemes, particularly in situations
where there are limited processing or graphical capabilities, such as with PDAs. |